Introduction
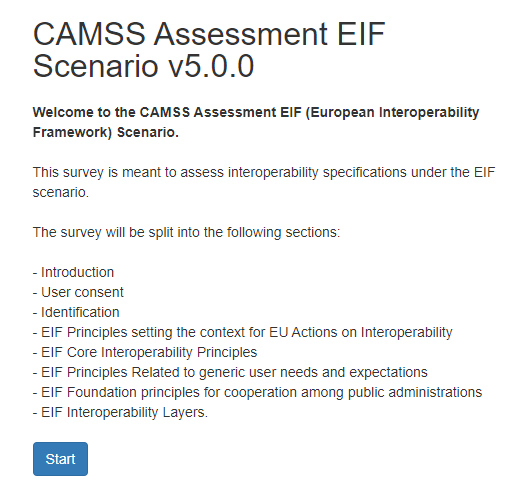
The CAMSS Assessment EIF Scenario contains different sections according to the insights and recommendations of the European Interoperability Framework (EIF).
The European Interoperability Framework (EIF) provides guidance to public administrations on how to improve the governance of their interoperability activities, establish cross-organisational relationships, streamline processes supporting end-to-end digital services, and ensure that existing and new legislation does not compromise interoperability efforts. This CAMSS Scenario allows for the assessment of the compliance of interoperability specifications with the EIF. The objective of the obtained assessment is to determine the suitability of the assessed interoperability specification for the delivery of interoperable European public services.
Apart from this user guide on how to use the CAMSS Assessment EIF Scenario in the European Platform EUSurvey, CAMSS also provides the CAMSS Methodology which aims to guide users on how to answer the criteria.
Purpose of this page
This custom page aims to explain CAMSS Tools work in EU Survey and ease the use of the tool to the users.
User Guide sections:
The first step is to access the CAMSS Assessment EIF Scenario in EU Survey:
EU Survey Functionalities
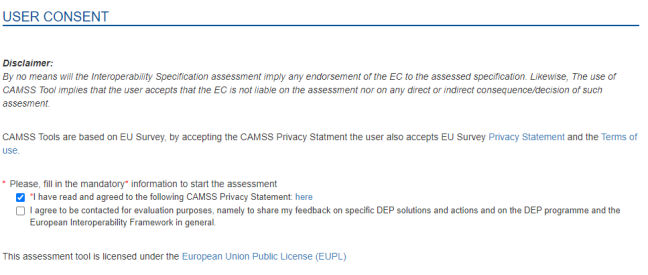
Mandatory fields
It is important to remark that there are mandatory fields to fill in order to advance through the different sections and pages in the forms.
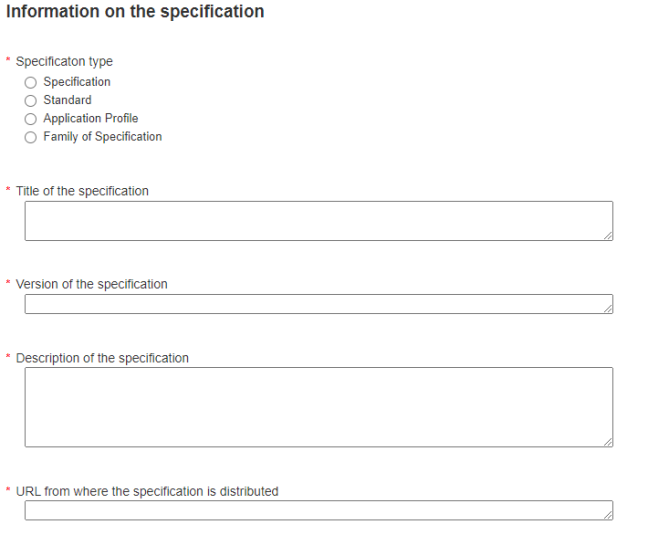
Within the section “Identification - Information on the Specification” there are relevant fields that are marked as mandatory, for example, the title of the specification and the SDO developing the specification.
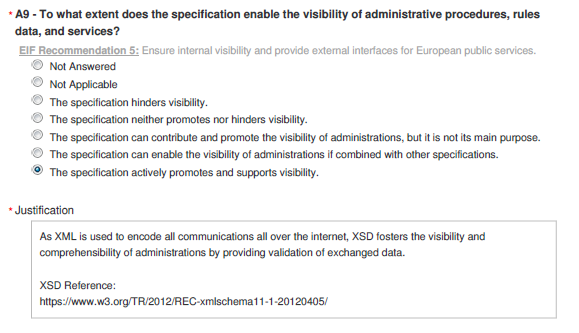
The assessments include different options for answering questions: Boolean (“YES”, “NO”, "Not Applicable", "Not Answered"), Gradients. Then, the user has to select the option that fit the specification and the criteria. And then, include the justification in the textbox below.
Please note that the "Not Applicable" answer is to be used when:
- Not enough information has been gathered to answer positive or negative to a criterion.
- Not enough information has been put in place to determine if the specification is addressing the requirement of the criterion, meaning that these requirements could be out of the area of application of the specification and therefore it is not applicable.
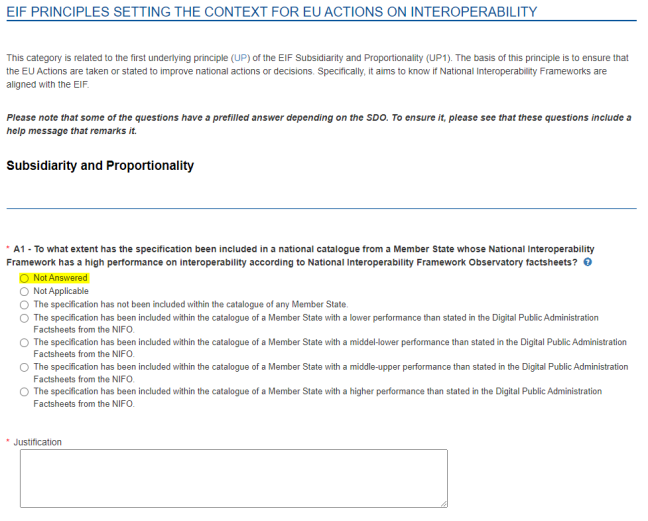
Prefilling options
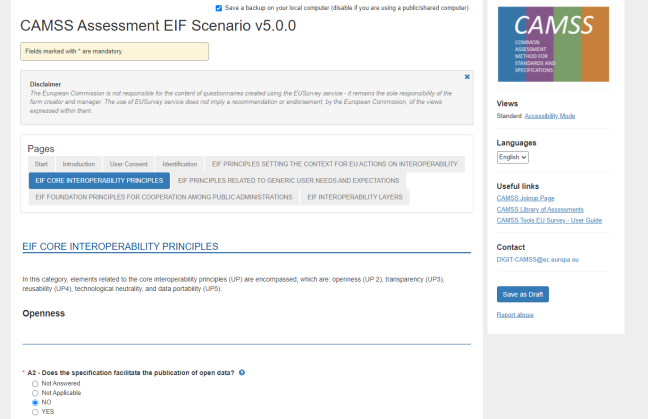
The different scenarios include prefilling options to ease the performance of the assessments. In some cases, questions include a help message informing that depending on the organisation (Standards Developing Organisation - SDO) developing the specification the answer has to be “YES”, “NO”, or maximum gradient. Moreover, there is an initial disclaimer that informs about this fact, see below:
Save as a draft
It is relevant to remark that EU Survey allows saving the form as a draft. However, it can only be done while doing the assessment. Meaning that if the user submits the form, it will not be possible to re-edit the assessment.
The figure below shows where it is the button “Save as a Draft” within the assessment form. The location is constant throughout all the assessment.
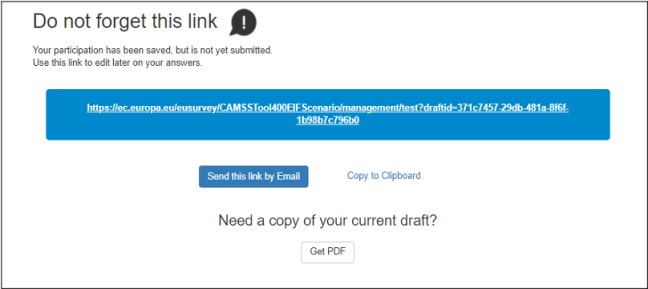
Therefore, it is very important to save the link to the draft to be able to access it on subsequent occasions.
This section aims to reflect how EU Survey represents the results and how they must be interpreted.
Result Visualisation
This section aims to show how the results page is organised.
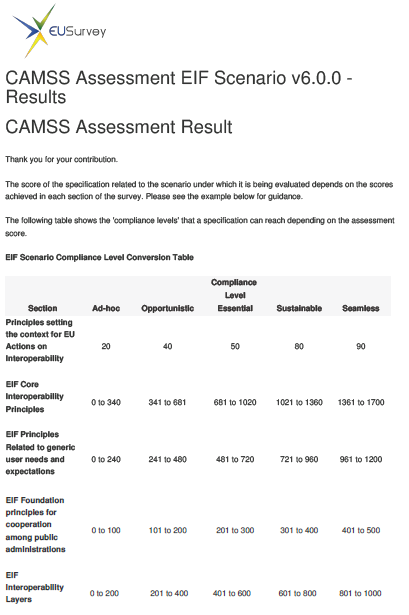
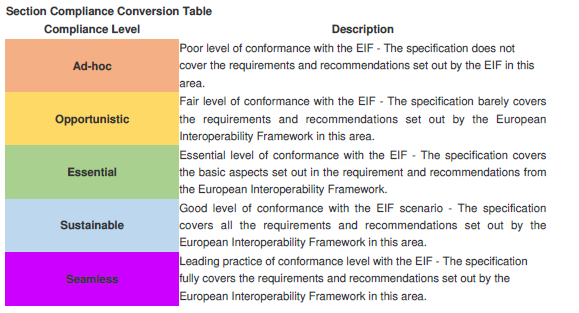
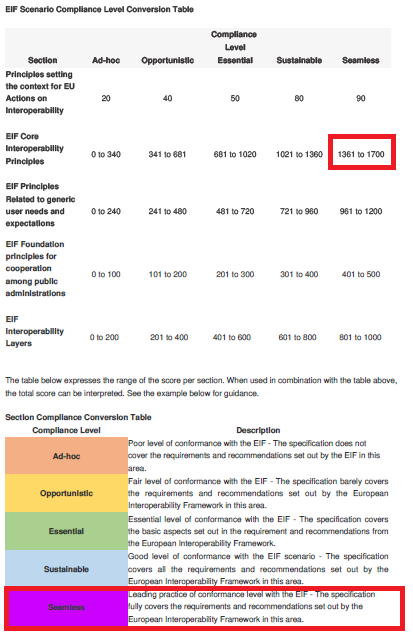
At the top of the page, the user will see the "Scenario Compliance Level Conversion Table". This table states the different compliance level and the description of each one. The interpretation of the results will be further explained within the next section "Results Visualisation".
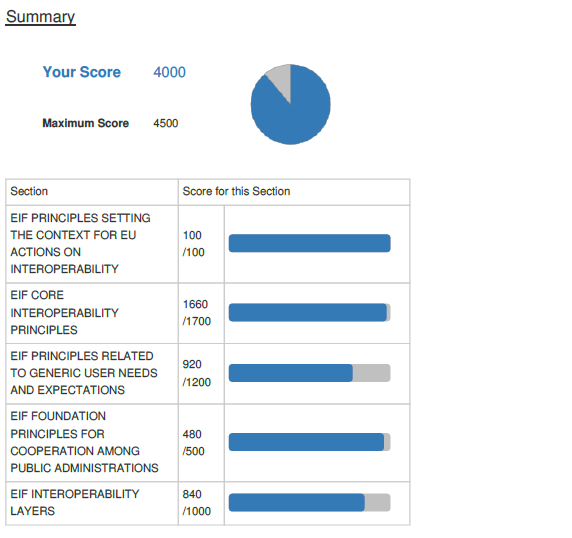
The first element after the tables for the interpretation of the results is the “Summary section”. This section provides an overall view of the total score reached and the score per section.
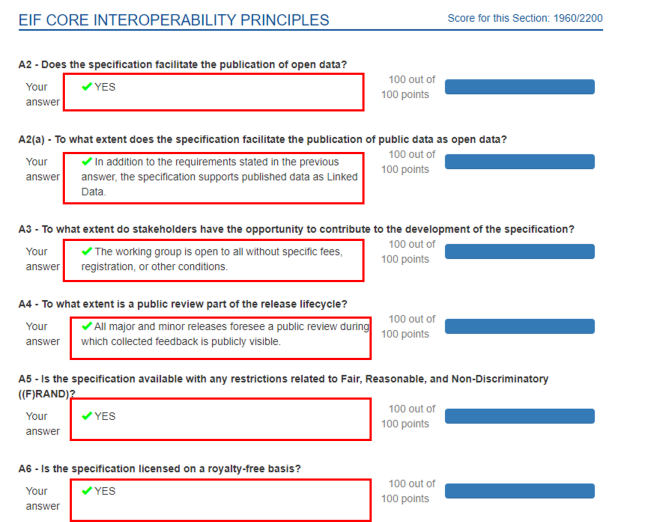
In second place, going down in the page result it shows the score per question:
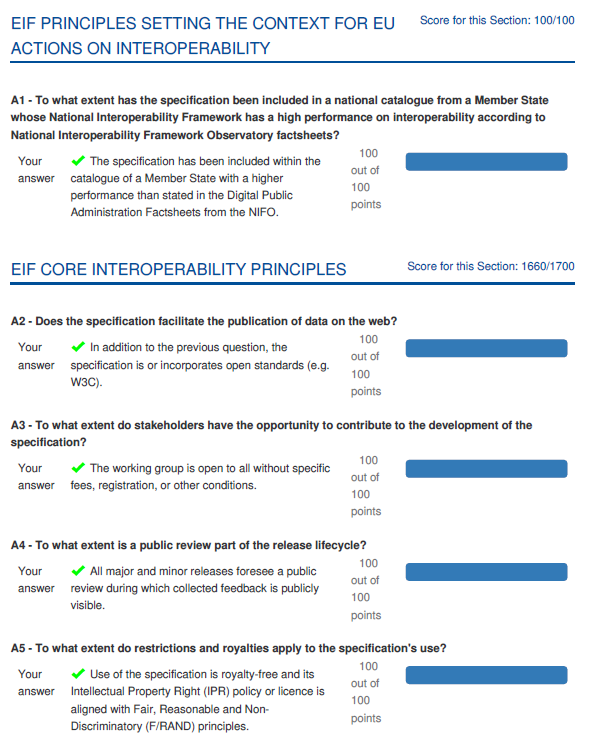
Note that this is just a snapshot of how it is represented, the section covers all sections and criteria.
Additionally, a pdf version of the assessment and results can be retrieved. To know how to get the PDFs of the assessment and the results please check the section “Get assessment in pdf. Result and form”
The following image is an extraction of a PDF generated with dummy values as an example. The document includes all the answers and justifications provided by the user.
Result Interpretation
After presenting how EU Survey represents the information of the results, now it is the turn of the interpretation of these results.
There are two aspects to consider: the score obtained directly from the assessment as shown before and the assessment strength.
- The score reached on the assessment is called automated score. And a conversion table needs to be used to get value and meaning.
- The assessment strength is an additional score that complements the automated score. It is further explained later in this section.
Assessment Score
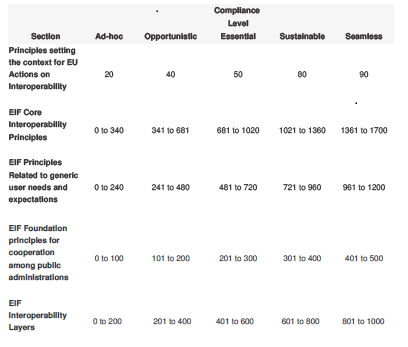
Once the user has submitted the questionnaire, the results page shows a conversion table as presented within the previous version. See the conversion tables below:


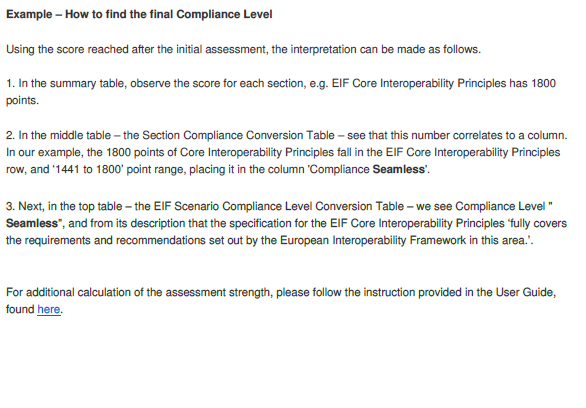
Exemplification of how to interpret the results (Assessment Score - Your Score):
This "Section Compliance Conversion Table" is related to the score of the assessment and each section. Then, having the summary of results per section and taking the EIF Core Interoperability Principles as reference:
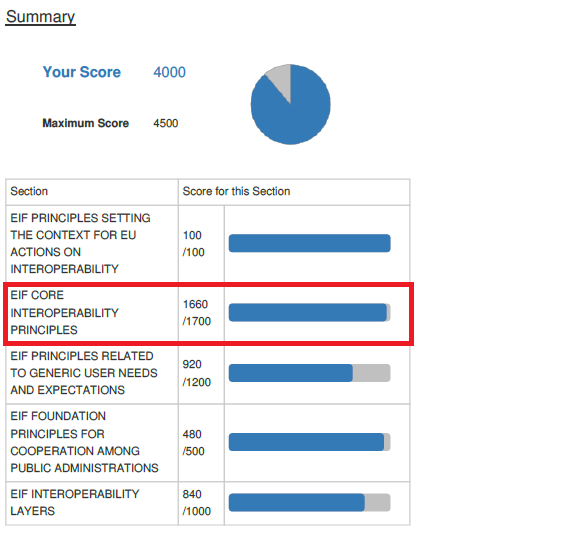
In the image above the score for this section is 1660, which is the maximum for this section as it can be read in the following image:
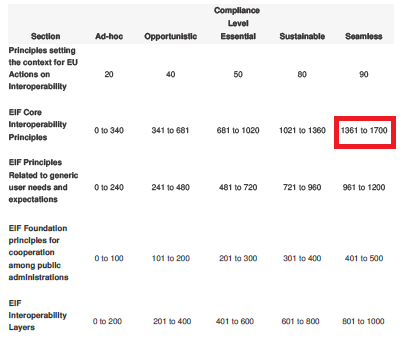
Therefore, the specification being assessed "is fully compliant with the requirements and recommendations set out by the European Interoperability Framework in this specific area". See the following images for clarification:
Exemplification of how to interpret the results (% Assessment Score):
Besides, the user might also get a percentage (%) of the overall assessment score. The % of the overall assessment score consists of the division between the total assessment score (Your Score) and the maximum assessment score (Maximum Score), where the % of the overall assessment score will not be considering the value of N/A (100 points).
Both parts of the fraction must be subtracted by the number of N/A answers 100 times. Then if from 3800 out of 4400 points there are 4 N/A answers, the current formula for calculating the % of the overall assessment score is (3800-4*100)/(4400-4*100)*100= 85%:
Example of this applicability in the EIF context:
Having that an assessment contains:
- 34 positive answers (YES)
- 6 negative answers (NO / Gradient Answer 20 points)
- 4 N/A answers.
And the formula is: [ (Your Score - # of N/A answers * 100) / (Maximum Score - # of N/A answers * 100) ]
Therefore, it would apply like this:
(3800-4*100)/(4400-4*100)*100= 85%
That is 85%, slightly lower than the initial 3800/4400*100 = 86.36%.
Assessment strength
The assessment strength aims to provide complementary information regarding the comprehensiveness of the assessment. This information is partially expressed in the results above.
Considering that the value of N/A is 0, it can affect the final result of the specification, however, it allows to see how strong the evaluation can be considered counting the % of positive and negative answers.
In this sense, the assessment strength purpose is to balance and complement these questions that have not been answered with negative or positive providing a % that can reflect the comprehensiveness and scale of accomplishment of the assessment by the evaluator.
The formula to calculate the assessment strength is:
[ ((Count (POSITIVE) + Count (NEGATIVE*)) / # of questions/criteria in scenario) * 100 ]
*Please note that the NEGATIVE answers include the "NO" and the gradient answers with a score of 20 points.
It works as follows:
- Count the POSITIVE answers
- Count the NEGATIVE answers
- Sum them
- Divide into the total number of questions (43)
- Multiply per 100 to get the percentage.
After applying the formula below to the results, the outcome will be a %. This percentage must be read on the following scale:
The higher is the % reached, the higher is the comprehensiveness of the assessment. Meaning that most of the questions have been answered positive or negative avoiding the usage of N/A possibility.
The following image is an example of the inputs needed to apply the formula.
As the image shows, within Scores By Question, the users can read the responses given to each question in the form, which need to be used as inputs for the calculation.
Example of this applicability in the EIF context:
Having that an assessment contains:
- 30 positive answers (YES)
- 5 negative answers (NO / Gradient Answer 20 points)
- 8 N/A answers.
And the formula is: [ ((Count (YES) + Count (NO / Gradient Answer 20 points)) / # of questions/criteria in scenario) * 100 ]
Therefore, it would apply like this:
((30+5)/43)*100= 81%
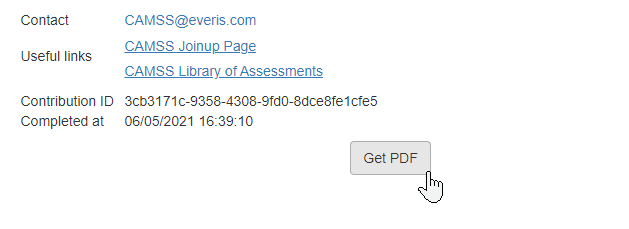
Get assessment in pdf. Result and form.
Once finished the assessment and submitted the form, please select the option “Get PDF” and you will be asked to provide an email where EU Survey will send a copy of the form and a copy of the results.