Recommendation 15: Communicate the benefits of integrating and using location information in digital public services
| Implementation guidance | Related information |
|---|---|
 Why
Why
- Clear metrics provide powerful messages.
- Communicating the benefits of strategic ‘infrastructure’ investments such as those related to data sharing and associated interoperability measures can be challenging and requires a different type of analysis to more straightforward ‘project’ investments.
- Communication of benefits supports investment and demonstrates to taxpayers that public administrations are spending their money to good effect.
- A business case investment approach based on evidence complements the evidence-based policy approach.
- Demonstration of benefits and how they are achieved in particular use cases helps in promoting wider reuse and delivery of benefits by others.
- User stories and examples of benefits are simpler to understand and more meaningful to most people than detailing the process followed, parties involved or technology used.
- Data sharing initiatives, particularly those involving high value datasets, have the potential for very large-scale reuse and benefits. To maximise benefits needs reaching out to the widest possible number of stakeholders. Effective communication is vital to achieve this aim.
 How
How
Purpose of communication
- Communication of benefits is done for a range of different purposes:
- To help create a ‘vision’ of what a policy or implementation project hopes to achieve. This will help secure interest and eventually support for the policy or implementation project. Different benefits may have different degrees of importance for different stakeholders. It is important to ‘target’ the benefits that will be important to these stakeholders (to obtain political backing, to help secure investment), to deliver the widest possible benefit (largest number of stakeholders), to deliver the largest benefit (areas of most significant impact);
- To secure commitment to a policy or project that will involve investment from multiple stakeholders (a national data programme may involve financial and time commitments from large numbers of stakeholders) or to secure financial backing within an organisation for its own proposed project or purchase. For these purposes, an ‘investment case’ will be needed that estimates net benefits (i.e. taking both benefits and costs into account). The investment also needs to be affordable (there is no point in having a good business case for a project for which funds are not available) and funding sources need to be clearly spelt out (this is particularly important where policies or projects involve distributed costs);
- To secure further investment by demonstrating success of a policy or project (this may be the case for a phased investment, where an intermediate milestone needs to be reached before further funding is made available) or by highlighting variations in certain investment parameters (typically in costs) where a re-justification of the investment is needed;
- To raise awareness of the initiative and its benefits to a wider stakeholder community. This may be done to encourage the adoption of the outputs of a project within an organisation (e.g. raising awareness with policy makers of an available location data service or location intelligence capability), to encourage target end-users to adopt a new location enabled digital public service (to broaden take-up and therefore delivery of benefits), or to raise awareness with stakeholders in other public or private sector organisations (to encourage participation, reuse of solutions, and extend the benefits);
- To promote an available location data product or service, illustrate how it may be used and the benefits for users, with the aim of increasing take-up and thereby either increase revenue or support the need for continued or additional funding for the location data product or service. There may also be a skills transfer impact of the communication, which will help raise the capacity needed to deliver benefits across the stakeholder community.
Evidence collection
- Use ‘strategic’ investment approaches, such as socio-economic analysis to assess overall market impacts, including impact on GDP of widespread re-use of high-quality interoperable location datasets. Key metrics such as impact on GDP present simple and powerful messages to support policies and investments. Evidence collected in one country can also encourage other countries to adopt similar approaches and help support cross border use cases.
- Apply localised result analysis, such as the impact on air quality, noise, congestion. Local evidence can be collated to form a broader geographical picture. Alternatively, different local scenarios drawn from measured evidence can be modelled to provide a broader geographical assessment.
- Indicators expressed in widely used terms can help in supporting investments and communication. Examples are local contributions to Sustainable Development Goals, expressed in terms of standardised indicators, INSPIRE monitoring results, European Open Data Maturity measurement, Digital Economy and Society Index (DESI), Covenant of Mayors Sustainable Energy and Climate Action Plans.
- Prepare ‘project’ business cases taking into account the potential benefits of an integrated approach to the use of location information in digital public services, using this information to inform investment decisions for particular services.
- In all impact assessments / business cases, it is essential to state the assumptions underlying both costs and benefits. If these are stated, future outcomes can be compared against them and adjustments made where relevant.
- Collect evidence on how the integration of location data and services can help public administrations improve their processes and achieve benefits. Measure benefits of particular investments to validate projected outcomes and make the case for further / continued funding.
Communication methods
- The different types of benefit associated with the use of location data and intelligence capabilities are described in Recommendation 12 under ‘What types of benefit to target?’. The types of benefit include productivity benefits, economic or financial benefits, social or environmental benefits, innovation and effectiveness, and democratic benefits.
- The types of benefit and information selected for communication will vary according to the purpose of the communication and the audience. Ensure the communication addresses the understanding and motivations of the target audience, for example whether they are policy or technically focused.
- It can be valuable in communication to provide both the overall picture in terms of benefits and one or more illustrations or ‘user stories’ to bring the communication to life. Use real life case studies and user stories to highlight benefits in a way that is understandable to the audience. These can help show how the approach and benefits achieved in one administration may also be applicable in other administrations or how benefits derived by users of a new digital public service may also be obtained if other users take advantage of the service.
- Include relevant quantitative and qualitative metrics in the communication to support the ‘case study’ or ‘user story’, for example the average time saved for each user, the cost saving for the administration, the improvement in environmental factors, or the improvement in user satisfaction in the introduction of the new service. Explanations of the before (ex-ante) and after (ex-post) scenarios can also be helpful in explaining how barriers have been removed and opportunities realised. Where possible the economic or financial impact should be included to convey the ‘value for money’ of a particular investment. A useful metric to present, in this respect, is the payback period for any investment.
- Ensure a ‘balanced assessment’ is given to counter any scepticism in the audience. This may include giving details of different scenarios to highlight best, worst and typical cases, providing details of net benefits (i.e. outline the costs as well as the benefits) or saying something about the assumptions used or the process undertaken in making any assessments. Socio-economic assessments that demonstrate large GDP impacts can provide impressive ‘results’ for communication but it can be helpful to say something about the way the numbers have been derived, including the risk-adjustments that have been made.
- In all cases of communication, the outcomes achieved should be highlighted. This should be accompanied by an appropriate degree of communication about how those outcomes were achieved, including the contribution of location data and interoperability measures. Where the audience is quite technical or the communication is to share knowledge on how something is done to achieve the benefits, a well-structured and detailed technical presentation will be relevant.
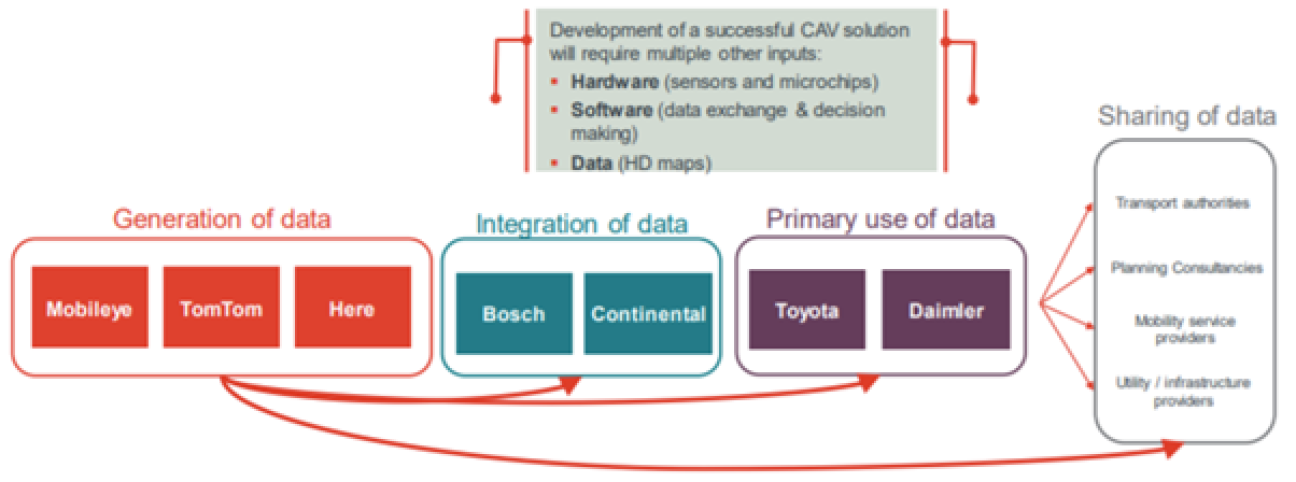
- Sometimes, the ‘user story’ involves describing a relatively complex network to show how benefits are derived through the interactions of different actors in a digital ecosystem or how a digital or data infrastructure can help remove barriers and enable new capabilities and benefits. A visual representation of the ‘value chain’ can be helpful in the communication, together with an explanation of the role of different actors and the impact on them of the changes being communicated. An example is shown below, which is taken from a Frontier Economics geospatial data market study undertaken for the UK Geospatial Commission in 2020.
Autonomous vehicle geospatial value chain
- Another example, this time from Denmark, is highlighted in Annex II, Benefits Illustration 12. This shows the value chain in using free geodata to assess flood risk for the purposes of urban planning, disaster management, insurance underwriting etc. See SCALGO Live Flood Risk and the associated value chain in the following presentation: The Impact of Open Geodata – follow up study after 5 years.
- Communicate benefits using relevant techniques appropriate to the purpose of the communication and the target audience. This may be factsheets, web-based documentation, videos, digital government ‘communication’ events involving public sector or external stakeholders etc.
Benefits illustrations
- There are many examples of the benefits of location data and associated interoperability measures in different sectors and situations. See EULF Blueprint: Benefits Illustrations for some typical applications, each with a general summary of the types of benefit and one or more specific case studies to act as illustration. Benefits are described for the following applications:
| Benefits Illustrations | Case Studies |
|---|---|
| Benefits Illustration 1: European data programmes | EU |
| Benefits Illustration 2: National data programmes | DK |
| Benefits Illustration 3: Geospatial strategic reviews | UK, AU, LT, NE |
| Benefits Illustration 4: Integration of data from external sources | PT, INT |
| Benefits Illustration 5: Address data | UK, DK |
| Benefits Illustration 6: Planning and construction | SE |
| Benefits Illustration 7: Routing applications | UK, NO, SE |
| Benefits Illustration 8: Public transport | UK |
| Benefits Illustration 9: Catchment area and transport planning | ES |
| Benefits Illustration 10: Asset maintenance | BE, NE, UK |
| Benefits Illustration 11: Agriculture and fisheries | AU, EU |
| Benefits Illustration 12: Environment | DK, INT |
| Benefits Illustration 13: Healthcare | KR, CZ, DE, FR, INT |
| Benefits Illustration 14: Fix My Street applications | PT, INT |
| Benefits Illustration 15: Meteorological services | INT, FI |
INT = International
Benefits template
- The following template can be used to summarise information relevant to the role of location data, interoperability measures and policy drivers, contributing to the benefits of an investment or policy change. This captures the main themes in the foregoing analysis.
| Heading / What to include |
|---|
| Name: Name of policy, project or service |
| Description: Description of policy, project or service |
| Stakeholders: Type / Role. Include different public administrations and external stakeholders. |
|
Scope and role of location data: Main location data produced or used as well as the geographical extent. Role of location data. Role types include:
|
|
Interoperability measures: List of interoperability measures incorporated in the policy or project implementation. For each measure, include:
|
|
Policy drivers: Policy name / relationship type / relationship description. Policy relationship types are:
|
|
Costs: Type / Stakeholders / Value / Method of measurement. Cost types include:
|
|
Benefits: Type / Stakeholders / Value / Method of measurement. Benefit types include:
|
| Start date: Date of initial implementation |
- Below is an example of the use of the location interoperability benefits template in an important policy development in Denmark, ‘Good Basic Data for All’, and the associated implementation programme, the 'Basic Data Programme'.
| Location interoperability benefits template - Basic Data Programme, Denmark | ||||
|---|---|---|---|---|
|
Name: Basic Data Programme |
||||
|
Description: ‘Good basic data for all’ was part of the Danish digitisation strategy 2011-2015. The vision was that basic data about individuals, businesses, real properties, buildings, addresses and more would be updated efficiently in one place and openly available to everyone, including the private sector. In this way, basic data would be a driver for efficiency and growth. The first free and open Basic Data was released in 2013 and the first standardised (interoperable) Basic Data was available through a ‘Common Data Distributor’ platform in 2017. The programme was completed in 2019. |
||||
|
Stakeholders: The Basic Data Programme stems from the agreement on ‘Good basic data for all’ between the government and KL (Association for Local governments in Denmark) in 2012. In 2013, the Danish Regions joined the agreement, making it binding for all of the public sector in Denmark. The programme was run by the Danish Digitisation Agency, within the Ministry of Finance. It operated at 3 levels:
Basic Data is distributed via a Basic Data Platform, which is the centre of a broad ecosystem of users, solution developers, and data and technology providers. There is a User Forum targeting broader use of Basic Data involving NGOs, citizens and SMEs. The Basic Data Board was closed down in 2020 and operation of the Basic Data Platform and further development of Basic Data in Denmark transferred from the Danish Digitisation Agency to the Agency for Data Supply and Efficiency (NMCA |
||||
|
Scope and role of location data: The main Basic Location Data are Addresses, Roads, Cadastral parcels (real property), Administrative Units, Place names, Elevation and topological maps. Coverage is for the whole of Denmark. There are many uses. Some examples can be found here: https://sdfe.dk/data-skaber-vaerdi/maanedens-anvender-cases-og-temaer. Key roles / uses of the basic location data are:
|
||||
|
Interoperability measures: The Basic Data Programme encompasses all 12 principles and 6 layers of the EIF and incorporates recommendations in all five focus areas of the EULF Blueprint. There is a Joint Public Digital Architecture based on the EIF, EIRA2 and other international frameworks and standards, including TOGAF and Archimate. See also, this white paper on the Common Public Sector Digital Architecture. A Common Public Sector Catalogue of Concept and Data Models is also available. From a legal interoperability perspective, the programme is fully aligned with the Common Public Sector Digitisation Strategies and the different laws enacted to secure the Basic Data Programme and its interoperability between registers. Examples of legislative changes were the revisions to the laws on properties and addresses. The programme is also aligned with the Danish INSPIRE legislation and the Danish Act on processing of personal data (addressing GDPR). |
||||
|
Policy drivers: Direct policy drivers: Growth and efficiency, Open Data policy The programme was mainly spurred by government foreseeing major economic challenges up to 2020:
The implementation and further development of the Basic Data Programme has been part of the rolling public sector digitisation strategies from 2011 onwards. The agreement on Good Basic Data for All (2012) clearly states the purpose to support growth and efficiency. Furthermore, the agreement text for the Basic Data Programme describes how “open access to basic data in the private sector is a potential source of innovation, growth and new jobs” and “public data can be used for completely new types of digital products and solutions. Indirect policy drivers: INSPIRE legislation INSPIRE was an indirect policy driver as most of the Basic Location Data was already covered by the Danish INSPIRE law and hence should be made available in a standardised manner meaning that there was a data and service foundation already as well as a legislative foundation for parts of the programme. The Basic Data Programme could have been done without INSPIRE but INSPIRE was an inspiration for the concept and a tested example of the approach to standardisation and interoperability. |
||||
|
Costs: The first agreement in 2012 covered the estimated cost in the business case of EUR 125m up to 2016. In 2017, further funding of EUR 7.2m was agreed and granted via the Finance Act 2018. To establish and run the Basic Data Platform, a 4+4 year contract was awarded to KMD. This ran out in 2019 and the Agency for Data Supply and Efficiency now operates the platform. A second tender will be launched in 2021. It has been necessary to adjust the cost schedule several times during the programme. Delays led to increased costs of DKK 120.5m. By the time implementation was completed in 2019, total programme costs were DKK 616.7m. |
||||
|
Benefits: The following programme benefits have been identified for different stakeholders: Citizens:
Businesses:
Public authorities:
Cost benefit analysis The Basic Data Programme was expected to reach EUR 100m annual savings for society by 2020, approximately 25% accruing to the public sector and 75% to the private sector. It was estimated that potential benefits of the programme would stabilise from 2017. Afterwards, benefits would exceed costs for all public entities. Moreover, better access to higher quality data could lead to economic growth in different sectors including real estate, telecommunications, and transport. Socio-economic analysis A baseline analysis was carried out estimating the socio-economic value of geodata in 2012 (pre open geodata). The analysis was repeated in 2016 (post open geodata). In both cases, information was collected through a survey of both public sector and private sector organisations. The follow-up study, published in 2017, reported an increase in the number of users of the online service from 800 to 60.000 and an increase in the number of site visits per annum from 800m to 3.3bn. Results from the analysis indicated that the socio-economic value of geodata more than doubled from an estimated 1.6 billion DKK in 2012 to 3.5 billion DKK in 2016. 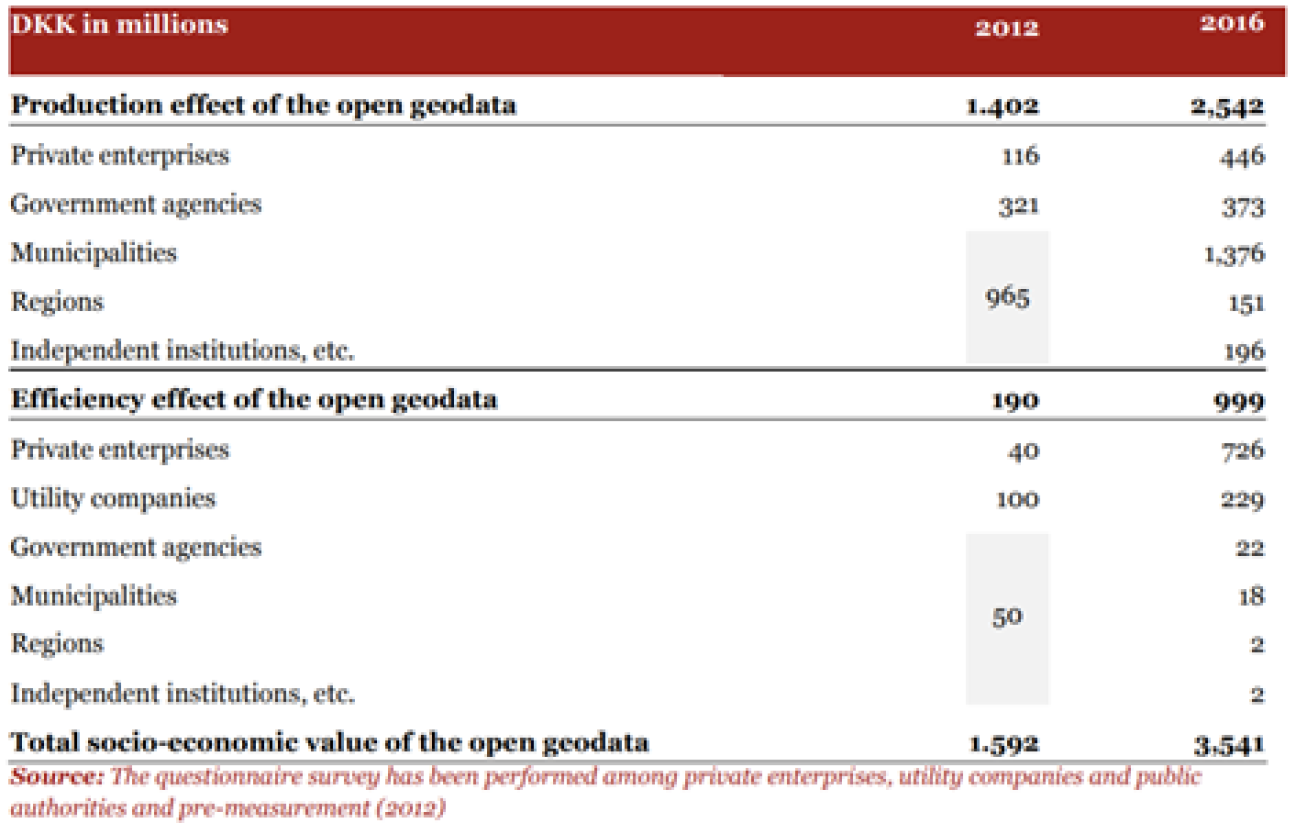
The method used for estimating the socio-economic value of geodata considered:
Socio-economic value was considered as the combination of production effects + efficiency effects. For different stakeholder groups, this was calculated as follows:
The Agency for Data Supply and Efficiency has recently published two analysis dealing with the value creation of open location data in the private sector and the value creation of open address data (in Danish). |
||||
|
Start date: January 2012 |
 Challenges
- Data infrastructure investments and the associated interoperability measures can be difficult to justify, although they can be seen as a necessary ongoing maintenance cost. Benefits do not come from the availability of the data, or the ease of finding and combining the data with other data but from the use of the data to create value.
- Monitoring and benchmarking in the context of digital public services often focuses on the main upstream activities of the value chain (readiness and availability), while the downstream elements (use and impact) are neglected because of the difficulty of finding this information.
- Indicators can sometimes be difficult to measure, with information provided too vague, general or abstract. Involve professional investment analysts to validate indicators.
- Impacts of new services or service improvements can be difficult to predict. This is why ongoing monitoring and targeting of improvements is needed. An iterative approach to service delivery and improvement (see recommendation 8) can also be beneficial.
- It can be difficult to understand and therefore communicate the large-scale benefits of strategic data sharing to those not directly involved in the collection, processing and use of the data. Furthermore, data providers do not always have a strong grasp of the different uses of their data and developers looking for suitable data will look for the easiest ways of obtaining the data they need and may neglect strategic solutions for more tactical approaches. It is important that data providers consider the wide range of uses of their data and developers put effort into ensuring strategic data sources are able to meet their needs. Good communication amongst the immediate ecosystem partners comes before communication of results from their efforts.
 Best Practices
- #13: KLIC to prevent damage caused by excavation works
- #14: Air quality monitoring and reporting
- #20: Digital platform for building permits
- #22: Standardised road safety data exchange
- #30: Location intelligence for groundworks: KLIP platform
- #33: Urban platform, Guimarães
- #42: Geodata use case portal
- #43: The impact of open geodata – follow up study
- #68: Dedicated organisation for the communication of geospatial activities and benefits at IGN-France
- #92: ESPUS (Effective management of spatial data and services)
 LIFO Monitoring
The Location Information Framework Observatory (LIFO) monitors the implementation of EULF Blueprint recommendations in European countries. Read about the implementation of Recommendation 15 in the LIFO Country Factsheets or the LIFO European State of Play Report. Explore the results for selected countries at LIFO Interactive Dashboards - Recommendations.
 Related Frameworks: European Interoperability Framework (EIF)
| EIF Pillars | Recommendations |
|---|---|
| Underlying Principle 12: Assessment of effectiveness and efficiency | Recommendation 19: Evaluate the effectiveness and efficiency of different interoperability solutions and technological options considering user needs, proportionality and balance between costs and benefits. |
Related Frameworks: UN-GGIM Integrated Geospatial Information Framework (IGIF)
Strategic Pathway 1: Governance and Institutions
| Documentation | Elements |
|---|---|
|
Leadership Value Proposition
|
| Actions | Tools |
|---|---|
| 3. Defining Value | |
| Strategic Alignment Study | APP1.2: Strategic Alignment Template |
| Value Proposition Statement | FIG1.6: Value Proposition Canvas |
| 4. Setting Direction | |
| Geospatial Information Management Strategy |
APP1.3: Guidance for Mission, Vision and Goals Statements Future trends in geospatial information management: the five to ten year vision (third edition) Global Statistical Geospatial Framework Framework for Effective Land Administration Strategic Framework on Geospatial Information and Services for Disasters COVID-19: Ready to Respond - The role of the Geospatial Community in Responding to COVID-19 |
| Change Strategy | |
| 5. Creating a Plan of Action | |
| Country-level Action Plan | APP1.4: Country-level Action Plan Template |
| 5. Tracking Success | |
| Monitoring and Evaluation | APP1.5: Monitoring and Evaluation Template |
| Success Indicators | APP1.6: Success Indicators |
Strategic Pathway 2: Policy and Legal
| Documentation | Elements |
|---|---|
|
Governance and Accountability |
| Actions | Tools |
|---|---|
| 4. Future Proofing | |
| Future Proofing | |
| 6. Delivering Compliance | |
| Impact Assessment |
Strategic Pathway 3: Financial
| Documentation | Elements |
|---|---|
|
Opportunities Investment Benefits Realisation |
| Actions | Tools |
|---|---|
| 2. Situational Assessment | |
| Current Business Model | APP3.4: Example of a Business Model Canvas |
| 3. Financial Plan | |
| Desired Business Model | APP3.5: Developing a Business Model - Some Considerations |
| 4. Case for Investment | |
| Socio-Economic Impact Assessment | APP3.7: Socio-Economic Impact Assessment Approach |
| Business Case | APP3.8: Components of a Business Case |
| Investment Appraisal | |
| 6. Deriving Value | |
| Benefits Realisation | |
| Communicate Benefits |
Strategic Pathway 9: Communication and Engagement
| Documentation | Elements |
|---|---|
|
Stakeholder and User Engagement Strategic Messaging Strategy, Plans and Methods Monitoring and Evaluation |
| Actions | Tools |
|---|---|
| 1. Providing Leadership | |
| Communication and Engagement Strategy | |
| Working Group | |
| Internal Communication | |
| 2. Understanding Opportunities | |
| Stakeholder Identification |
APP9.1: Categories of Stakeholders APP9.2: Identifying and Classifying Stakeholders |
| Stakeholder Analysis | APP9.3: Stakeholder Analysis Matrix |
| 3. Setting Direction | |
| Policy Platform | |
| Geospatial Brand | |
| Strategic Messages | |
| 4. Creating Plan of Action | |
| Communication Plan |
APP9.4: Stakeholder Analysis and Communication APP9.5: Stakeholder Communication Plan |
| Communication Methods |
APP9.6: Communication Methods APP9.7: Communication Methods - Advantages and Disadvantages |
| 5. Monitoring Progress | |
| Review and Evaluation | APP9.8: Review and Evaluation - Methods for Benchmarking |
| Stakeholder Surveys | |
| 6. Communicating Value | |
| Benefits Communications | |
| Lessons Learned Resource |
 ELISE Resources
 Further Reading
- NASA: Geospatial Interoperability Return on Investment Study, Booz Allen Hamilton, 2005
- The economic benefits of precision agriculture: case studies from Australian grain farms, GRDC and CSIRO Sustainable Ecosystems, 2007
- The Value of Danish Address Data, 2010
- The Value of Geospatial Information to Local Public Service Delivery in England and Wales, 2010
- The Value of Geospatial Information in Local Public Service Delivery, Schmidt, G, Local Government Association, Westminster Briefing, 2010
- Review of Recent Studies on PSI Re-use and Related Developments, Vickery 2011
- Assessing Social Benefits in Sweden, INSPIRE Conference, 2011
- Beyond Interoperability, OGC, INSPIRE Conference, 2011
- INSPIRE in Danish e-Government, 2012
- Estimating Benefits of Spatial Data Infrastructures: A Case Study on e-Cadastres, 2012
- Finnish INSPIRE benefits study, 2012
- What is the Economic Impact of Geo Services? - a report prepared by Oxera for Google, 2013
- Valuing Geospatial Information: a review, Alan Smart, Andy Coote, INSPIRE Conference, 2013
- OECD Working Paper on “Open Government Data: Towards Empirical Analysis of Open Government Data Initiatives”, 2013
- Spatial Data Infrastructure (SDI) Manual for the Americas, provided by the Permanent Committee for Geospatial Data Infrastructure of the Americas (PCIDEA, now UN-GGIM Americas), 2013
- Precision Agriculture – An Opportunity for EU Framers – Potential Support with the CAP 2014-2020, European Parliament, DG for Internal Policies and Joint Research Centre, 2014
- Management of On-demand Transport Services in Urban Contexts, Barcelona Case Study, 2015
- Cost Benefit Analysis of Address and Street Data for Local Authorities and Emergency Services in England and Wales, 2016 – Identifies a 4:1 return on investment
- The Business Impact of GIS - Case Studies from Utah, Kloos W, Utah Department of Natural Resources, ESRI, 2016
- Cost benefit analysis of increased production and improved availability of marine geospatial data, Menon Economics, 2016
- Making the case for data standards - Final business case for local waste services, Local Digital Coalition, UK, 2016
- Economic and Financial Modelling of the Impact of Geospatial Information - Techniques and Results for land administration in developing Nations, Smart, A and Coote, A, Office International du Cadastre et du Régime Foncier (OICRF), Land and Poverty Conference, 2017
- The impact of the open geographical data – follow up study, Agency for Data Supply and Efficiency, Denmark, 2017
- The impact of open geodata in Denmark - follow up study after 5 years, INSPIRE Conference 2017 Presentation Video
- The Economic Impact of Geospatial Services, AlphaBeta, 2017
- Towards a Spatial Knowledge Infrastructure, Australia and New Zealand Cooperative Research Centre for Spatial Information (CRCSI) White Paper, 2017
- The Economic Impact to the UK of a GNSS Disruption, London School of Economics, 2017
- The economic benefits of Open Data, data.europa.eu, 2017
- Interoperability in the digital economy, MAGKS Joint Discussion Paper Series in Economics, Kerber, Wolfgang; Schweitzer, Heike Philipps, University of Marburg, School of Business and Economics, 2017
- Assessing the Economic Value of 3D Geo-information, EuroSDR, 2017
- Assessing the value of Transport for London’s open data and digital partnerships, 2017
- The Economic Value of Spatial Information in New South Wales for 2017 and 2022
- Impacts of Open Data in Luxembourg and the Greater Region – 2018
- Economic value of spatially enabled services in Finland, Spatineo, 2018
- Measurement activities related to open data, Lämmerhirt, D, State of Open Data, International Development Research Centre, Canada, 2018
- An Initial Analysis of the Potential Geospatial Economic Opportunity, UK Geospatial Commission, 2018
- Google Analytics information about the Flemish geoportal “Geopunt”: the pro’s and con’s, INSPIRE Conference 2018
- Large scale precision agriculture – Farming Tools for External Nutrients Inputs and Water Management (FATIMA) project, INSPIRE Conference, 2018
- Economic benefit of a unified national geodata approach in the community building process, Lantmäteriet, Sweden 2019
- Economic and social benefits of data access and sharing, OECD iLibrary, 2019
- Cross port benefits of geospatial technology, Port Strategy, 2019
- National Underground Asset Register pilot, UK, 2019
- eGovernment Benchmark 2019
- The value of Integrated Geospatial and Building Information Modelling (BIM) solutions to advance the United Nations Sustainable Development Goals (Agenda 2030) with specific focus on resilient infrastructure, UN-GGIM, WFEO, and WGIC, 2020
- Geospatial Data Market Study, Report for the UK Geospatial Commission, Frontier Economics, 2020
- Measuring and Mapping Data Reuse: Findings from an Interactive Workshop on Data Citation and Metrics for Data Reuse, Federer, L, Harvard Data Science Initiative, 2020
- Impact Assessment study on the list of High Value Datasets to be made available by the Member States under the Open Data Directive, 2020
- Lithuania INSPIRE 2020 country fiche
- Commission Recommendation (EU) 2020/518 on a common Union toolbox for the use of technology and data to combat and exit from the COVID-19 crisis
- Guidelines 04/2020 on the use of location data and contact tracing tools in the context of the COVID-19 outbreak
- John Hopkins COVID-19 Dashboard
- The Value of Surface-based Meteorological Observation Data, World Bank, 2021
- Unlocking Value with Location Intelligence, Boston Consulting Group, 2021
- The Netherlands Geospatial Economy Report, Geospatial Media and Communications, Ministry of the Interior and Kingdom Relations of the Netherlands and Geonovum, 2021
- The Value of Surface-based Meteorological Observation Data, 2021
- INSPIRE Knowledge Base: Monitoring and Reporting
- United Nations e-Government Surveys
- Open Data Institute: Benchmarking open data automatically
- GeoSamen - showcasing what the geosector has to offer, Netherlands
- Ordnance Survey Case Studies, UK
- GeoPlace Case Studies, UK
- TomTom Traffic Index
- Vaisala blog: Day to Day Benefits of Weather Detection
- Social Value International
- Fin Est Digital Twin Cities, Helsinki and Tallinn
- 4 Key Benefits of Agtech for Farmer Co-ops, Foodie Project
- Sonderborg, Project Zero
- Covenant of Mayors
- UN Sustainable Development Goals
- Sites running on the FixMyStreet platform
- Vaisala blog: Day to Day Benefits of Weather Detection
- SCALGO Live Flood Risk